Рассмотрим легковесный мониторинг Prometheus + Grafana на Docker контейнерах. У меня появилась необходимость мониторинга своих виртуальных машин расположенных на домашнем сервере
Начнем с создания docker-compose.yml файла. В нем будет перечислены все необходимые контейнеры:
- Prometheus - система агрегации метрик
- Grafana - визуализатор данных, к ней будет подлюкчен наш Prometheus-сервер
- Node-exporter - контейнер считывающий данные с хост-системы и передающий в Prometheus
- Alertmanager - менеджер уведомлений, для оповещения о возникновении проблем и их решений
Docker Compose
version: '3'
services:
  prometheus:
    container_name: prometheus
    hostname: prometheus
    image: prom/prometheus
    restart: unless-stopped
    user: root
    volumes:
      - ./prometheus/prometheus.yml:/etc/prometheus/prometheus.yml
      - ./prometheus/alert_rules.yml:/etc/prometheus/alert_rules.yml
      - ./prometheus/prometheus_data:/prometheus
    command:
      - '--config.file=/etc/prometheus/prometheus.yml'
      - '--storage.tsdb.retention=200h'
    ports:
      - 9090:9090

  grafana:
    container_name: grafana
    hostname: grafana
    image: grafana/grafana
    restart: unless-stopped
    user: root
    volumes:
      - ./grafana/grafana_datasources.yml:/etc/grafana/provisioning/datasources/all.yaml
      - ./grafana/grafana_config.ini:/etc/grafana/config.ini
      - ./grafana/grafana_data:/var/lib/grafana
    ports:
      - 3000:3000

  node-exporter:
    image: prom/node-exporter
    container_name: node-exporter
    restart: unless-stopped
    volumes:
      - /proc:/host/proc:ro
      - /sys:/host/sys:ro
      - /:/rootfs:ro
    command:
      - '--path.procfs=/host/proc'
      - '--path.sysfs=/host/sys'
      - '--collector.filesystem.ignored-mount-points'
      - "^/(sys|proc|dev|host|etc|rootfs/var/lib/docker/containers|rootfs/var/lib/docker/overlay2|rootfs/run/docker/netns|rootfs/var/lib/docker/aufs)($$|/)"
    #ports:
      #- 9100:9100

  alertmanager:
    image: prom/alertmanager
    container_name: alertmanager
    restart: unless-stopped
    volumes:
      - ./alertmanager/alertmanager.yml:/etc/alertmanager/alertmanager.yml
      - ./alertmanager/templates:/etc/alertmanager/templates
    command: --config.file=/etc/alertmanager/alertmanager.yml --log.level=debug
    #ports:
      #- 9093:9093
Рассмотрим каждый контейнер и начнем с самого Prometheus
prometheus:
    container_name: prometheus
    hostname: prometheus
    image: prom/prometheus
    restart: unless-stopped
    user: root
    volumes:
      - ./prometheus/prometheus.yml:/etc/prometheus/prometheus.yml
      - ./prometheus/alert_rules.yml:/etc/prometheus/alert_rules.yml
      - ./prometheus/prometheus_data:/prometheus
    command:
      - '--config.file=/etc/prometheus/prometheus.yml'
      - '--storage.tsdb.retention=200h'
    ports:
      - 9090:9090
volumes:
./prometheus/prometheus.yml - основной конфиг Prometheus
./prometheus/alert_rules.yml - настройка правил алретнов, при каких условиях алерты будут срабатывать
./prometheus/prometheus_data - данные Prometheus, по своей сути это файловая БД. Если место на хосте будет заканчитваться. Базу можно будет удалить и пересоздать контейнер заново
command:
--config.file=/etc/prometheus/prometheus.yml' - конфиг-файл, который мы пробросили в контейнер
'--storage.tsdb.retention=200h' - параметр, который будет чистить базу от метрик, у которых время жизни привышает 200 часов (~15 дней)
C Prometheus закончили, перейдем к Grafana
  grafana:
    container_name: grafana
    hostname: grafana
    image: grafana/grafana
    restart: unless-stopped
    user: root
    volumes:
      - ./grafana/grafana_datasources.yml:/etc/grafana/provisioning/datasources/all.yaml
      - ./grafana/grafana_config.ini:/etc/grafana/config.ini
      - ./grafana/grafana_data:/var/lib/grafana
    ports:
      - 3000:3000
Тут все просто. В файле grafana_datasources.yml будут перечислены данные подключения Grafana к Prometheus. Этот файл не обязателен, настройку подключения можно сделать через GUI.
grafana_config.ini - содержит основной конфиг настройки Grafana
grafana_data - данная директория будет хранить в себе остальные данные. Такие как, шаблоны алертов, плагины, SQLite базу
Перейдем к Node-exporter
  node-exporter:
    image: prom/node-exporter
    container_name: node-exporter
    restart: unless-stopped
    volumes:
      - /proc:/host/proc:ro
      - /sys:/host/sys:ro
      - /:/rootfs:ro
    command:
      - '--path.procfs=/host/proc'
      - '--path.sysfs=/host/sys'
      - '--collector.filesystem.ignored-mount-points'
      - "^/(sys|proc|dev|host|etc|rootfs/var/lib/docker/containers|rootfs/var/lib/docker/overlay2|rootfs/run/docker/netns|rootfs/var/lib/docker/aufs)($$|/)"
    #ports:
      #- 9100:9100
Для Node-exporter, не требуется особых настроек. Достаточно просто его запустить и указать в Prometheus конфиге. Порт был закомментирован, потому как Node-exporter и Prometheus будут находится на одном хосте, в одной виртуальной Docker сети.
mkdir -p ./prometheus/prometheus_data ./grafana/grafana_data ./alertmanager/templates
Так же, нам необходимо создать каждый файл относительно той папки, в который вы находитесь. Заполнением и разбором данных файлов мы сейчас займемся.
./prometheus/prometheus.yml
## prometheus.yml ##

# global settings
global:
  scrape_interval:     15s # Set the scrape interval to every 15 seconds. Default is every 1 minute.
  evaluation_interval: 15s # Evaluate rules every 15 seconds. The default is every 1 minute.
  # scrape_timeout is set to the global default (10s).

# Connect alertmanager
alerting:
  alertmanagers:
    - static_configs:
      - targets: ["alertmanager:9093"]

# Load rules once and periodically evaluate them according to the global 'evaluation_interval'.
rule_files:
  - /etc/prometheus/alert_rules.yml

# A scrape configuration containing exactly one endpoint to scrape:
# Here it's Prometheus itself.
scrape_configs:
  - job_name: prometheus
    static_configs:
      - targets: [ 'localhost:9090' ]
        labels:
          container: 'prometheus'

  - job_name: node-exporter-clients
    scrape_interval: 5s
    static_configs:
      - targets:
        - node-exporter:9100
Думаю тут все ясно, так как есть комментарии. Если есть вопросы, то есть документация: https://prometheus.io/docs/prometheus/latest/configuration/configuration/
global: - глобальные настройки
alerting: alertmanagers: - подключение Alert Manager
rule_files - подключаемые файлы с правилами и правилами алертов
scrape_configs - подключение узлов на которых установлен Node exporter
./prometheus/alert_rules.yml
Разберем файл который взаимодействует с данными Prometheus и Alertmanages. Я не смог найти, где конкретно был найдено содержимое файла. Тут просто описаны условия при которых будут прилетать алерты для node-exporter.
По ссылке на этом сайте можно найти другие правила алертов, для других приложений. https://samber.github.io/awesome-prometheus-alerts/rules.html
groups:
- name: node_exporter_alerts
  rules:
  - alert: Node down
    expr: up{job="monitoring-pi"} == 0
    for: 2m
    labels:
      severity: warning
    annotations:
      title: Node {{ $labels.instance }} is down
      description: Failed to scrape {{ $labels.job }} on {{ $labels.instance }} for more than 2 minutes. Node seems down.


  - alert: HostOutOfMemory
    expr: node_memory_MemAvailable_bytes / node_memory_MemTotal_bytes * 100 < 10
    for: 2m
    labels:
      severity: warning
    annotations:
      summary: Host out of memory (instance {{ $labels.instance }})
      description: Node memory is filling up (< 10% left)\n  VALUE = {{ $value }}

  - alert: HostMemoryUnderMemoryPressure
    expr: rate(node_vmstat_pgmajfault[1m]) > 1000
    for: 2m
    labels:
      severity: warning
    annotations:
      summary: Host memory under memory pressure (instance {{ $labels.instance }})
      description: The node is under heavy memory pressure. High rate of major page faults\n  VALUE = {{ $value }}

  - alert: HostUnusualNetworkThroughputIn
    expr: sum by (instance) (rate(node_network_receive_bytes_total[2m])) / 1024 / 1024 > 100
    for: 5m
    labels:
      severity: warning
    annotations:
      summary: Host unusual network throughput in (instance {{ $labels.instance }})
      description: Host network interfaces are probably receiving too much data (> 100 MB/s)\n  VALUE = {{ $value }}

  - alert: HostUnusualNetworkThroughputOut
    expr: sum by (instance) (rate(node_network_transmit_bytes_total[2m])) / 1024 / 1024 > 100
    for: 5m
    labels:
      severity: warning
    annotations:
      summary: Host unusual network throughput out (instance {{ $labels.instance }})
      description: Host network interfaces are probably sending too much data (> 100 MB/s)\n  VALUE = {{ $value }}

  - alert: HostUnusualDiskReadRate
    expr: sum by (instance) (rate(node_disk_read_bytes_total[2m])) / 1024 / 1024 > 50
    for: 5m
    labels:
      severity: warning
    annotations:
      summary: Host unusual disk read rate (instance {{ $labels.instance }})
      description: Disk is probably reading too much data (> 50 MB/s)\n  VALUE = {{ $value }}

  - alert: HostUnusualDiskWriteRate
    expr: sum by (instance) (rate(node_disk_written_bytes_total[2m])) / 1024 / 1024 > 50
    for: 2m
    labels:
      severity: warning
    annotations:
      summary: Host unusual disk write rate (instance {{ $labels.instance }})
      description: Disk is probably writing too much data (> 50 MB/s)\n  VALUE = {{ $value }}

  # Please add ignored mountpoints in node_exporter parameters like
  # "--collector.filesystem.ignored-mount-points=^/(sys|proc|dev|run)($|/)".
  # Same rule using "node_filesystem_free_bytes" will fire when disk fills for non-root users.
  - alert: HostOutOfDiskSpace
    expr: (node_filesystem_avail_bytes * 100) / node_filesystem_size_bytes < 10 and ON (instance, device, mountpoint) node_filesystem_readonly == 0
    for: 2m
    labels:
      severity: warning
    annotations:
      summary: Host out of disk space (instance {{ $labels.instance }})
      description: Disk is almost full (< 10% left)\n  VALUE = {{ $value }}

  # Please add ignored mountpoints in node_exporter parameters like
  # "--collector.filesystem.ignored-mount-points=^/(sys|proc|dev|run)($|/)".
  # Same rule using "node_filesystem_free_bytes" will fire when disk fills for non-root users.
  - alert: HostDiskWillFillIn24Hours
    expr: (node_filesystem_avail_bytes * 100) / node_filesystem_size_bytes < 10 and ON (instance, device, mountpoint) predict_linear(node_filesystem_avail_bytes{fstype!~"tmpfs"}[1h], 24 * 3600) < 0 and ON (instance, device, mountpoint) node_filesystem_readonly == 0
    for: 2m
    labels:
      severity: warning
    annotations:
      summary: Host disk will fill in 24 hours (instance {{ $labels.instance }})
      description: Filesystem is predicted to run out of space within the next 24 hours at current write rate\n  VALUE = {{ $value }}

  - alert: HostOutOfInodes
    expr: node_filesystem_files_free{mountpoint ="/rootfs"} / node_filesystem_files{mountpoint="/rootfs"} * 100 < 10 and ON (instance, device, mountpoint) node_filesystem_readonly{mountpoint="/rootfs"} == 0
    for: 2m
    labels:
      severity: warning
    annotations:
      summary: Host out of inodes (instance {{ $labels.instance }})
      description: Disk is almost running out of available inodes (< 10% left)\n  VALUE = {{ $value }}

  - alert: HostInodesWillFillIn24Hours
    expr: node_filesystem_files_free{mountpoint ="/rootfs"} / node_filesystem_files{mountpoint="/rootfs"} * 100 < 10 and predict_linear(node_filesystem_files_free{mountpoint="/rootfs"}[1h], 24 * 3600) < 0 and ON (instance, device, mountpoint) node_filesystem_readonly{mountpoint="/rootfs"} == 0
    for: 2m
    labels:
      severity: warning
    annotations:
      summary: Host inodes will fill in 24 hours (instance {{ $labels.instance }})
      description: Filesystem is predicted to run out of inodes within the next 24 hours at current write rate\n  VALUE = {{ $value }}

  - alert: HostUnusualDiskReadLatency
    expr: rate(node_disk_read_time_seconds_total[1m]) / rate(node_disk_reads_completed_total[1m]) > 0.1 and rate(node_disk_reads_completed_total[1m]) > 0
    for: 2m
    labels:
      severity: warning
    annotations:
      summary: Host unusual disk read latency (instance {{ $labels.instance }})
      description: Disk latency is growing (read operations > 100ms)\n  VALUE = {{ $value }}

  - alert: HostUnusualDiskWriteLatency
    expr: rate(node_disk_write_time_seconds_totali{device!~"mmcblk.+"}[1m]) / rate(node_disk_writes_completed_total{device!~"mmcblk.+"}[1m]) > 0.1 and rate(node_disk_writes_completed_total{device!~"mmcblk.+"}[1m]) > 0
    for: 2m
    labels:
      severity: warning
    annotations:
      summary: Host unusual disk write latency (instance {{ $labels.instance }})
      description: Disk latency is growing (write operations > 100ms)\n  VALUE = {{ $value }}

  - alert: HostHighCpuLoad
    expr: 100 - (avg by(instance) (rate(node_cpu_seconds_total{mode="idle"}[2m])) * 100) > 80
    for: 0m
    labels:
      severity: warning
    annotations:
      summary: Host high CPU load (instance {{ $labels.instance }})
      description: CPU load is > 80%\n  VALUE = {{ $value }}

  - alert: HostCpuStealNoisyNeighbor
    expr: avg by(instance) (rate(node_cpu_seconds_total{mode="steal"}[5m])) * 100 > 10
    for: 0m
    labels:
      severity: warning
    annotations:
      summary: Host CPU steal noisy neighbor (instance {{ $labels.instance }})
      description: CPU steal is > 10%. A noisy neighbor is killing VM performances or a spot instance may be out of credit.\n  VALUE = {{ $value }}

  # 1000 context switches is an arbitrary number.
  # Alert threshold depends on nature of application.
  # Please read: https://github.com/samber/awesome-prometheus-alerts/issues/58
  - alert: HostContextSwitching
    expr: (rate(node_context_switches_total[5m])) / (count without(cpu, mode) (node_cpu_seconds_total{mode="idle"})) > 1000
    for: 0m
    labels:
      severity: warning
    annotations:
      summary: Host context switching (instance {{ $labels.instance }})
      description: Context switching is growing on node (> 1000 / s)\n  VALUE = {{ $value }}

  - alert: HostSwapIsFillingUp
    expr: (1 - (node_memory_SwapFree_bytes / node_memory_SwapTotal_bytes)) * 100 > 80
    for: 2m
    labels:
      severity: warning
    annotations:
      summary: Host swap is filling up (instance {{ $labels.instance }})
      description: Swap is filling up (>80%)\n  VALUE = {{ $value }}

  - alert: HostSystemdServiceCrashed
    expr: node_systemd_unit_state{state="failed"} == 1
    for: 0m
    labels:
      severity: warning
    annotations:
      summary: Host SystemD service crashed (instance {{ $labels.instance }})
      description: SystemD service crashed\n  VALUE = {{ $value }}

  - alert: HostPhysicalComponentTooHot
    expr: node_hwmon_temp_celsius > 75
    for: 5m
    labels:
      severity: warning
    annotations:
      summary: Host physical component too hot (instance {{ $labels.instance }})
      description: Physical hardware component too hot\n  VALUE = {{ $value }}

  - alert: HostNodeOvertemperatureAlarm
    expr: node_hwmon_temp_crit_alarm_celsius == 1
    for: 0m
    labels:
      severity: critical
    annotations:
      summary: Host node overtemperature alarm (instance {{ $labels.instance }})
      description: Physical node temperature alarm triggered\n  VALUE = {{ $value }}

  - alert: HostRaidArrayGotInactive
    expr: node_md_state{state="inactive"} > 0
    for: 0m
    labels:
      severity: critical
    annotations:
      summary: Host RAID array got inactive (instance {{ $labels.instance }})
      description: RAID array {{ $labels.device }} is in degraded state due to one or more disks failures. Number of spare drives is insufficient to fix issue automatically.\n  VALUE = {{ $value }}

  - alert: HostRaidDiskFailure
    expr: node_md_disks{state="failed"} > 0
    for: 2m
    labels:
      severity: warning
    annotations:
      summary: Host RAID disk failure (instance {{ $labels.instance }})
      description: At least one device in RAID array on {{ $labels.instance }} failed. Array {{ $labels.md_device }} needs attention and possibly a disk swap\n  VALUE = {{ $value }}

  - alert: HostKernelVersionDeviations
    expr: count(sum(label_replace(node_uname_info, "kernel", "$1", "release", "([0-9]+.[0-9]+.[0-9]+).*")) by (kernel)) > 1
    for: 6h
    labels:
      severity: warning
    annotations:
      summary: Host kernel version deviations (instance {{ $labels.instance }})
      description: Different kernel versions are running\n  VALUE = {{ $value }}

  - alert: HostOomKillDetected
    expr: increase(node_vmstat_oom_kill[1m]) > 0
    for: 0m
    labels:
      severity: warning
    annotations:
      summary: Host OOM kill detected (instance {{ $labels.instance }})
      description: OOM kill detected\n  VALUE = {{ $value }}

  - alert: HostEdacCorrectableErrorsDetected
    expr: increase(node_edac_correctable_errors_total[1m]) > 0
    for: 0m
    labels:
      severity: info
    annotations:
      summary: Host EDAC Correctable Errors detected (instance {{ $labels.instance }})
      description: Instance has had {{ printf "%.0f" $value }} correctable memory errors reported by EDAC in the last 5 minutes.\n  VALUE = {{ $value }}

  - alert: HostEdacUncorrectableErrorsDetected
    expr: node_edac_uncorrectable_errors_total > 0
    for: 0m
    labels:
      severity: warning
    annotations:
      summary: Host EDAC Uncorrectable Errors detected (instance {{ $labels.instance }})
      description: Instance has had {{ printf "%.0f" $value }} uncorrectable memory errors reported by EDAC in the last 5 minutes.\n  VALUE = {{ $value }}

  - alert: HostNetworkReceiveErrors
    expr: rate(node_network_receive_errs_total[2m]) / rate(node_network_receive_packets_total[2m]) > 0.01
    for: 2m
    labels:
      severity: warning
    annotations:
      summary: Host Network Receive Errors (instance {{ $labels.instance }}:{{ $labels.device }})
      description: Instance interface has encountered {{ printf "%.0f" $value }} receive errors in the last five minutes.\n  VALUE = {{ $value }}

  - alert: HostNetworkTransmitErrors
    expr: rate(node_network_transmit_errs_total[2m]) / rate(node_network_transmit_packets_total[2m]) > 0.01
    for: 2m
    labels:
      severity: warning
    annotations:
      summary: Host Network Transmit Errors (instance {{ $labels.instance }}:{{ $labels.device }})
      description: Instance has encountered {{ printf "%.0f" $value }} transmit errors in the last five minutes.\n  VALUE = {{ $value }}

  - alert: HostNetworkInterfaceSaturated
    expr: (rate(node_network_receive_bytes_total{device!~"^tap.*"}[1m]) + rate(node_network_transmit_bytes_total{device!~"^tap.*"}[1m])) / node_network_speed_bytes{device!~"^tap.*"} > 0.8
    for: 1m
    labels:
      severity: warning
    annotations:
      summary: Host Network Interface Saturated (instance {{ $labels.instance }}:{{ $labels.interface }})
      description: The network interface is getting overloaded.\n  VALUE = {{ $value }}

  - alert: HostConntrackLimit
    expr: node_nf_conntrack_entries / node_nf_conntrack_entries_limit > 0.8
    for: 5m
    labels:
      severity: warning
    annotations:
      summary: Host conntrack limit (instance {{ $labels.instance }})
      description: The number of conntrack is approching limit\n  VALUE = {{ $value }}

  - alert: HostClockSkew
    expr: (node_timex_offset_seconds > 0.05 and deriv(node_timex_offset_seconds[5m]) >= 0) or (node_timex_offset_seconds < -0.05 and deriv(node_timex_offset_seconds[5m]) <= 0)
    for: 2m
    labels:
      severity: warning
    annotations:
      summary: Host clock skew (instance {{ $labels.instance }})
      description: Clock skew detected. Clock is out of sync.\n  VALUE = {{ $value }}

  - alert: HostClockNotSynchronising
    expr: min_over_time(node_timex_sync_status[1m]) == 0 and node_timex_maxerror_seconds >= 16
    for: 2m
    labels:
      severity: warning
    annotations:
      summary: Host clock not synchronising (instance {{ $labels.instance }})
      description: Clock not synchronising.\n  VALUE = {{ $value }}
Расписывать данный файл не вижу смысла. Но вы можете сюда добавлять свои правила при которых будут срабатывать алерты
./grafana/grafana_datasources.yml
## grafana_datasources.yml ##

apiVersion: 1

datasources:
  - name: 'prometheus'
    type: 'prometheus'
    access: 'proxy'
    url: 'http://prometheus:9090'
Тут все просто, мы указываем название подключения, тип и HTTP адрес. Повторюсь, что данный файл подключать не обязательно данную настройку можно выполнить и в самой графане.
./grafana/grafana_config.ini
## grafana_config.ini ##

[paths]
provisioning = /etc/grafana/provisioning

[server]
enable_gzip = true
Тут тоже не много настроек, если нужно больше, можно найти все в документации https://grafana.com/docs/grafana/latest/setup-grafana/configure-grafana/
./alertmanager/alertmanager.yml
route:
  receiver: telegram-alert-manager
  repeat_interval: 5m
templates:
  - '/etc/alertmanager/templates/telegram.default.message'
receivers:
  - name: 'telegram-alert-manager'
    telegram_configs:
      - bot_token:
        api_url: https://api.telegram.org
        chat_id:
        send_resolved: true
        parse_mode: 'HTML'
        disable_notifications: false
        message: '{{ template "telegram.default.message" .}}'
В данном примере у меня настроена нотификация в моего Telegram бота. Рассмотрим нужные поля
bot_token - сюда мы должны вставить токен своего бота
chat_id: - id чата, куда бот будет доставлять сообщения
Я не слишком разбирался в теме настройки нотификации, просто нашел и скопировал из готовых решений, немного поправив параметры обращаясь к документации.
https://prometheus.io/docs/prometheus/latest/configuration/configuration/#alertmanager_config
./alertmanager/templates/telegram.default.message
{{ define "telegram.default.message" }}
{{ range .Alerts }}
{{ if eq .Status "firing"}}🔥 <b>{{ .Labels.alertname }}</b> 🔥{{ else }}✅ <b>{{ .Labels.alertname }}</b> ✅{{ end }}
<b>Labels:</b>{{ range $key, $value := .Labels }}{{ if ne $key "alertname" }}
    <b>{{ $key }}</b>: <i>{{ $value }}</i>{{ end }}{{ end }}
<b>Annotations:</b>{{ range $key, $value := .Annotations }}
    <b>{{ $key }}</b>: <i>{{ $value }}</i>{{ end }}
{{ end }}
{{ end }}
А в этом файле сформирован шаблон сообщения, которое будет перед отправкой предварительно формироваться и уже после отправлено в Телеграм бота.
Настройка серверной части завершена. Поднимем все контейнеры разом
docker compose up -d
И мы должны увидеть примерно вот такую картину (uptime kuma уже было у меня ранее установлена)

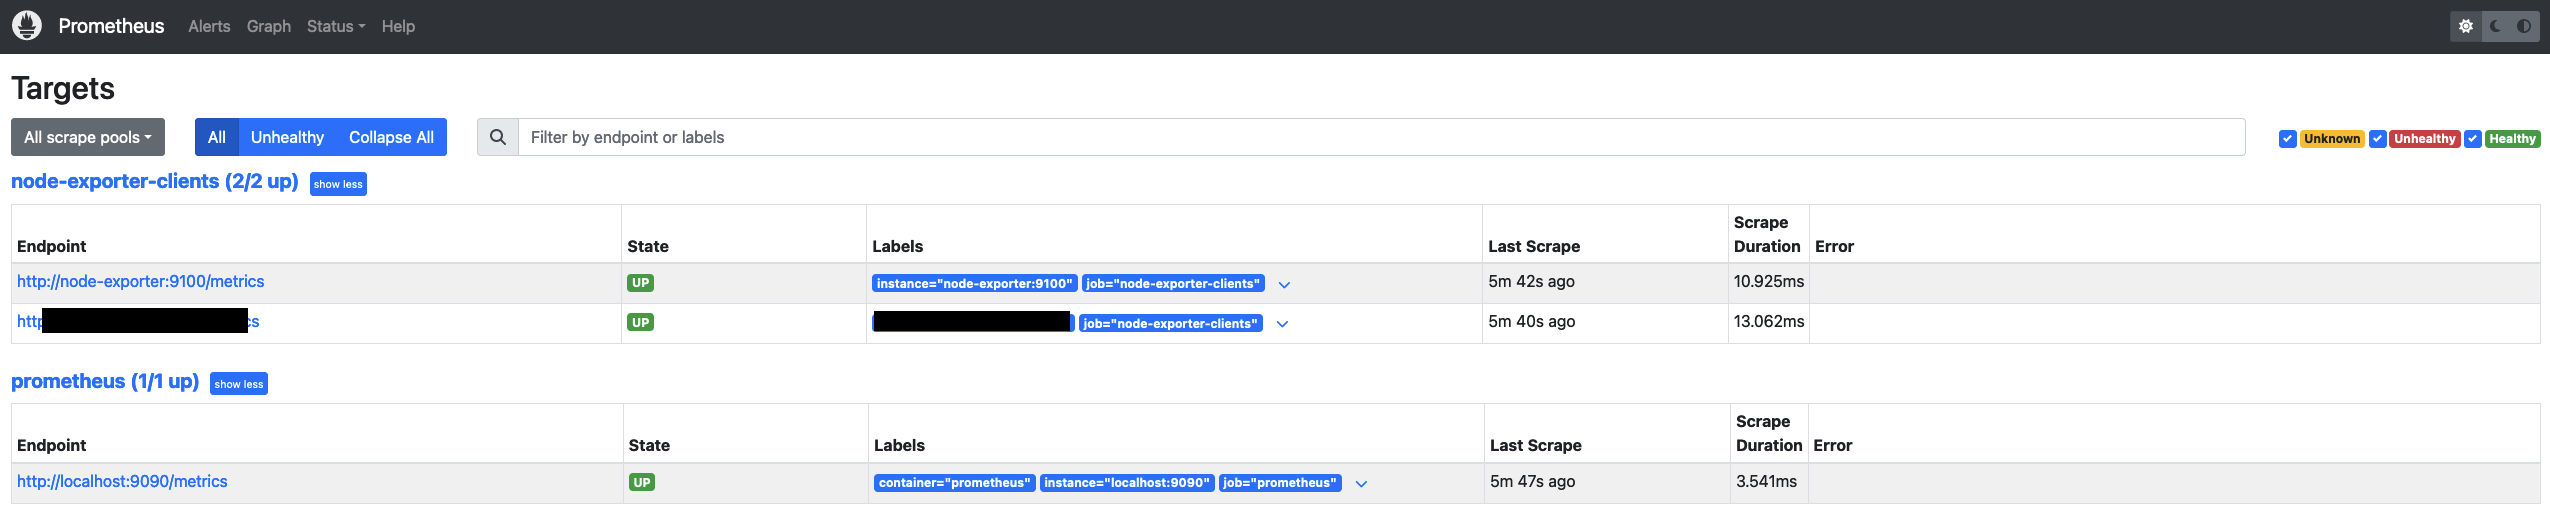
Давайте убедимся в работе Prometheus и перейдем по ссылке http://<ip>:9090/targets?search=
Обратите внимание, что данные передаются в открытом виде, без шифрования. Если у вас есть необходимость в шифровании данных, потребуется использовать либо реверс прокси, поднимать VPN или пробрасывать порты через SSH. Тут решать каждому, нужно ли ему шифрование или нет. Для локальной сети это не так важно.
Анонсы и еще больше информации в Telegram-канале